12 Jul 2026
Echoes in the Data: How Analytics Bridge Reel Mechanics, Dealer Interactions, and Athletic Markets
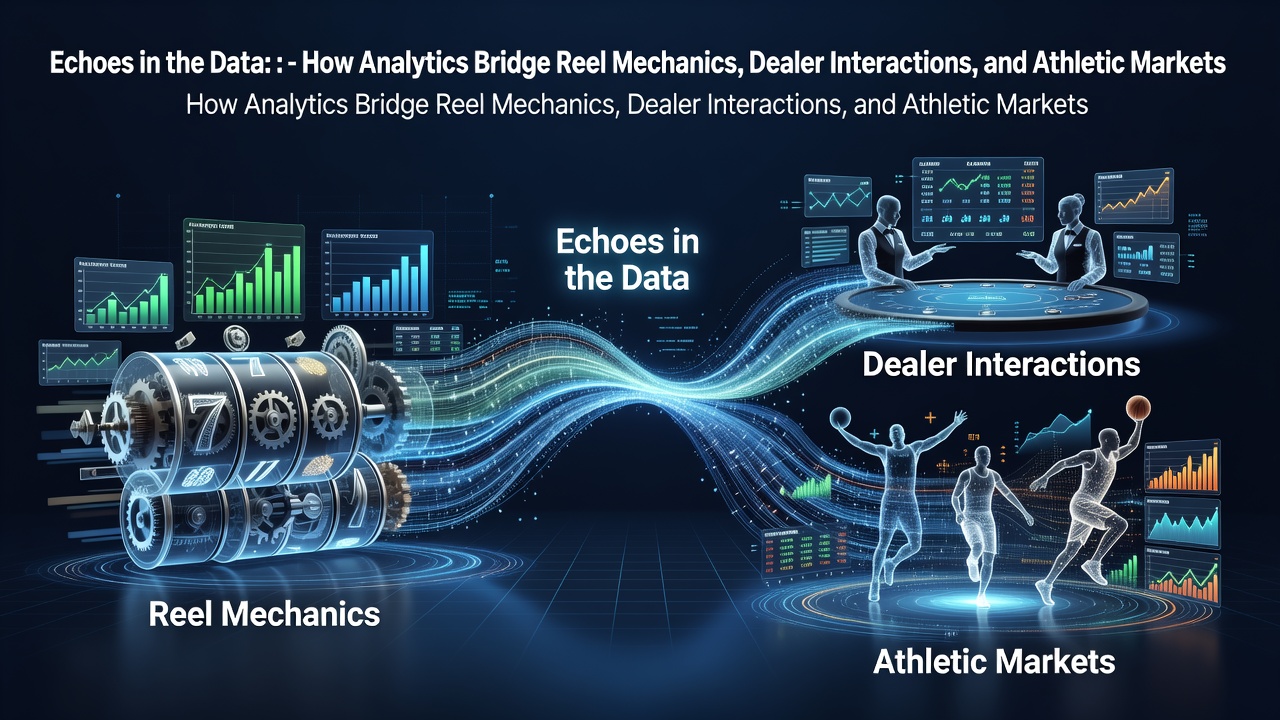
Analytics platforms now pull together reel mechanics from slot systems, timing patterns in dealer interactions, and shifting odds in athletic markets into unified datasets that operators monitor in real time, and researchers track these flows because they reveal how player behavior moves across product types without requiring separate tracking tools for each category.
Reel Mechanics Under the Microscope
Slot systems generate millions of spin outcomes daily, each one logged with details on reel positions, symbol combinations, and bonus trigger frequencies, while analytics engines compare those figures against historical baselines to flag deviations that might signal hardware issues or player preference shifts, and in July 2026 several North American operators reported integrating these same datasets with live table feeds to spot cross-product correlations that had previously stayed hidden in siloed logs.
Operators use heat maps of reel stop positions to adjust game configurations, yet the real advance comes when those maps link to broader player journey data, because a cluster of near-miss patterns on one title sometimes aligns with increased table game activity later in the same session, and studies from the University of Nevada's International Gaming Institute have documented such linkages across multi-product platforms.
Dealer Interaction Patterns Enter the Equation
Live dealer environments produce their own data streams, including card distribution sequences, pace of play metrics, and player decision timestamps, and these elements feed into the same analytics layers that already process reel data, allowing platforms to correlate a run of high-card outcomes at blackjack with subsequent bet size increases on connected sports markets, while the integration happens through standardized APIs that pull everything into one dashboard.
Cross-Product Correlations in Practice
One mid-sized operator in the European market observed that sessions featuring extended dealer interaction times showed measurable upticks in live betting activity on concurrent athletic events, and the pattern held across multiple weeks of tracked data, prompting the firm to adjust promotional timing so that table game incentives appeared alongside sports odds boosts rather than in isolation.
Athletic Markets as the Third Data Pillar
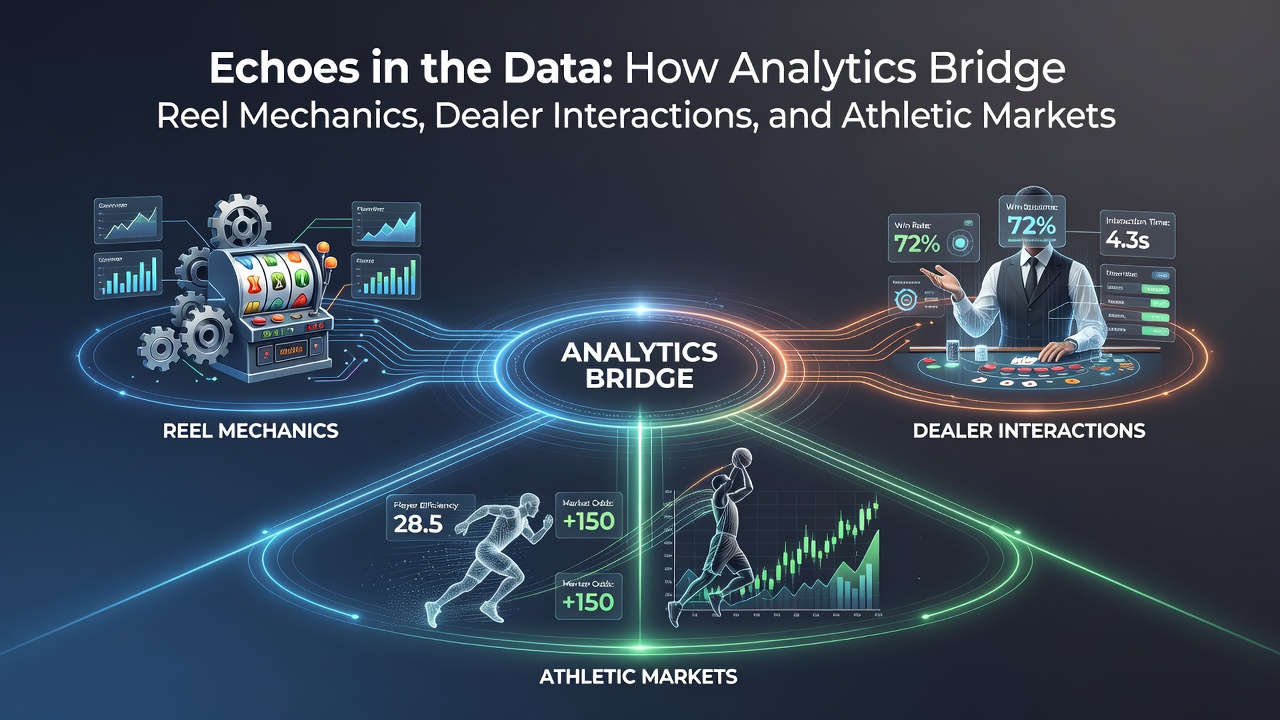
Sports betting platforms contribute odds movement histories, in-play event timestamps, and settlement volumes that analytics systems now align with both reel and dealer datasets, and this three-way view shows how a major league outcome can influence subsequent slot session lengths or table game dwell times, whereas earlier models treated sports data as standalone, but the combined approach reveals feedback loops that operators use for inventory management across verticals.
According to figures released by the Ontario Lottery and Gaming Corporation in early 2026, integrated analytics reduced the time required to identify underperforming titles by 34 percent when reel, dealer, and sports data sat in the same environment, and similar efficiency gains appear in reports from Australian operators who adopted comparable architectures.
Technical Bridges That Make Integration Possible
Modern data pipelines rely on event-driven architectures that tag each action with a universal player identifier and timestamp, allowing reel stops, dealer decisions, and market wagers to appear on the same timeline, while privacy-compliant hashing keeps individual records protected yet still permits aggregate pattern analysis, and the result is a single source of truth that compliance teams and product managers access without duplicating storage infrastructure.
Those who have implemented these systems note that the payoff appears most clearly during peak periods, because a sudden surge in athletic market volatility can be cross-checked against reel performance in adjacent time windows, and the correlation sometimes points to promotional opportunities that would have been missed under separate reporting structures.
Regulatory and Operational Implications
Regulators in multiple jurisdictions now request consolidated reports that include cross-vertical analytics, and the requirement pushes operators toward unified platforms rather than patchwork solutions, while industry associations such as the World Lottery Association have published guidelines on data governance that emphasize consistent tagging across product lines, and these standards help firms demonstrate that monitoring covers every channel without creating redundant audit trails.
July 2026 saw several Canadian provincial bodies update their data submission templates to include fields for cross-product correlation metrics, and operators that had already built unified analytics reported smoother compliance cycles as a direct result.
Conclusion
The convergence of reel mechanics data, dealer interaction logs, and athletic market movements into shared analytics environments continues to reshape how operators allocate resources and design player experiences, and the trend shows no sign of reversing as more jurisdictions adopt consolidated reporting expectations and as technical standards for event tagging become more widely adopted across the sector.